Vanishing Neutrons
How to test if a new particle detector works, and if it can see vanishing neutrons.
Why do we exist? When we look around the universe we can see stars and galaxies in every direction. Why is this all here? In this project, working with scientists around Europe, we begin to search for new answers.
This project will help researchers at the European Spallation Source (ESS) in Lund (a future neutron beam facility) make a new detector to answer this fundamental question. To answer the question of why we exist, we have to know why there is far more matter in our universe than antimatter. We know we have new evidence for this if we shoot neutrons through space and some randomly become antineutrons (their own "mirror image"), so we tested a prototype detector using a proton beam as a proxy for that signature in Krakow (this will be explained below).
A team of around 20 physicists are currently working on HIBEAM (High-Intensity Baryon Extraction and Measurement, which basically means measuring neutrons) based in Lund, Sweden. Comparing the data they obtained in Krakow with simulations we ran at the University of Edinburgh in Scotland allowed us to find out how well our detector worked.
Shooting protons or neutrons?
In the introduction above you may have noticed the mention of a "signature", and that despite the final experiment using a neutron beam, we are using a proton beam to test the prototype. In fact, these two questions are related to each other.
In particle physics, a signature is what a particle can be detected by: some particles, such as neutrons, are very difficult to detect. So instead of detecting them directly, they can be detected by the products they leave behind when they smash into something. In essence that is what our detector is - something for the particles to smash into and leave a trace that can be detected. In the case of antineutrons, they smash up and leave behind several "pions". These are a mixture of particles slighty smaller than neutrons and protons, with charges of , or .
Pion Products
*This figure is purely illustrative - not a simulation!
This animation shows antineutrons "annihilating" matter particles (mirror images cancelling each other out). The leftover energy is released as pions.
Our detector is a time projection chamber made of mostly argon (a box where we can trace particle's paths) - there is no magnetic field so the paths are all straight. We can use a proton beam as the pion signature is in some ways comparable to the protons. We can look at how much energy the protons lose passing through the detector, the directions and paths they take and how quickly they lose energy at different angles to see if the detector is working well.
There are also other processes going on that we cannot control that will affect our data - like random fluctuations called noise in our electronics, and particles showering our detector from space called cosmic muons (heavy electrons showering on Earth caused by radiation from space entering the atmosphere).
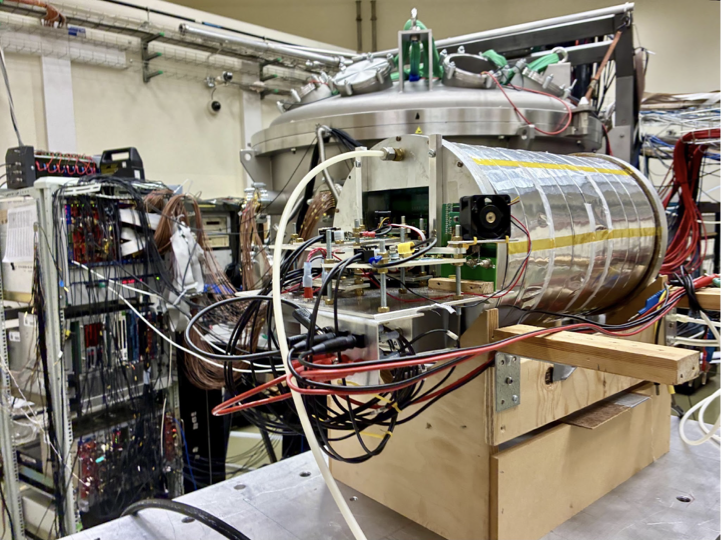
The Prototype TPC
Inside this time projection chamber, the argon gas mixture serves as the target area to detect the protons coming in. If you look closely at the silver cylinder you can see a black square - this is the detector part of the chamber - the cuboid in the interactive mock-ups below. This picture was taken by Blahoslav Rataj.
Simulating the detector
We simulated protons passing through our detector as they did in Krakow.
By clicking above you will be able to visualise exactly what the detectors in this experiment look like! The simulations were done using those exact geometries.
Does it work?
We can look at how much energy the protons lose when passing through our detector with a energy loss graph. This means a graph of the change in the amount of energy deposited in the detector per unit of length travelled in the detector (so if the path lengths are different this discrepancy is divided out).
Energy Loss Spectrum
Prototype Time Projection Chamber
* This is an approximate fit and not the one used in the final report - for illustrative purposes only.
We know this distribution should follow a function called the "Landau Distribution" - which looks similar to a normal distribution; however, the positive side has a long tail as particles initially lose a lot of energy and lose less the further the pass through the medium. This function cannot be analytically solved however, so we use an approximation for it called the Moyal distribution. We can see the fit matches the data, apart from the positive tail not being fully modelled. This is due to the approximations we have made here (on this web page).
We can then conclude that our detector is functioning by comparing this simulation here to data! If they match well enough then we can move forward and add new modifications to the prototype to better model the final HIBEAM detector.